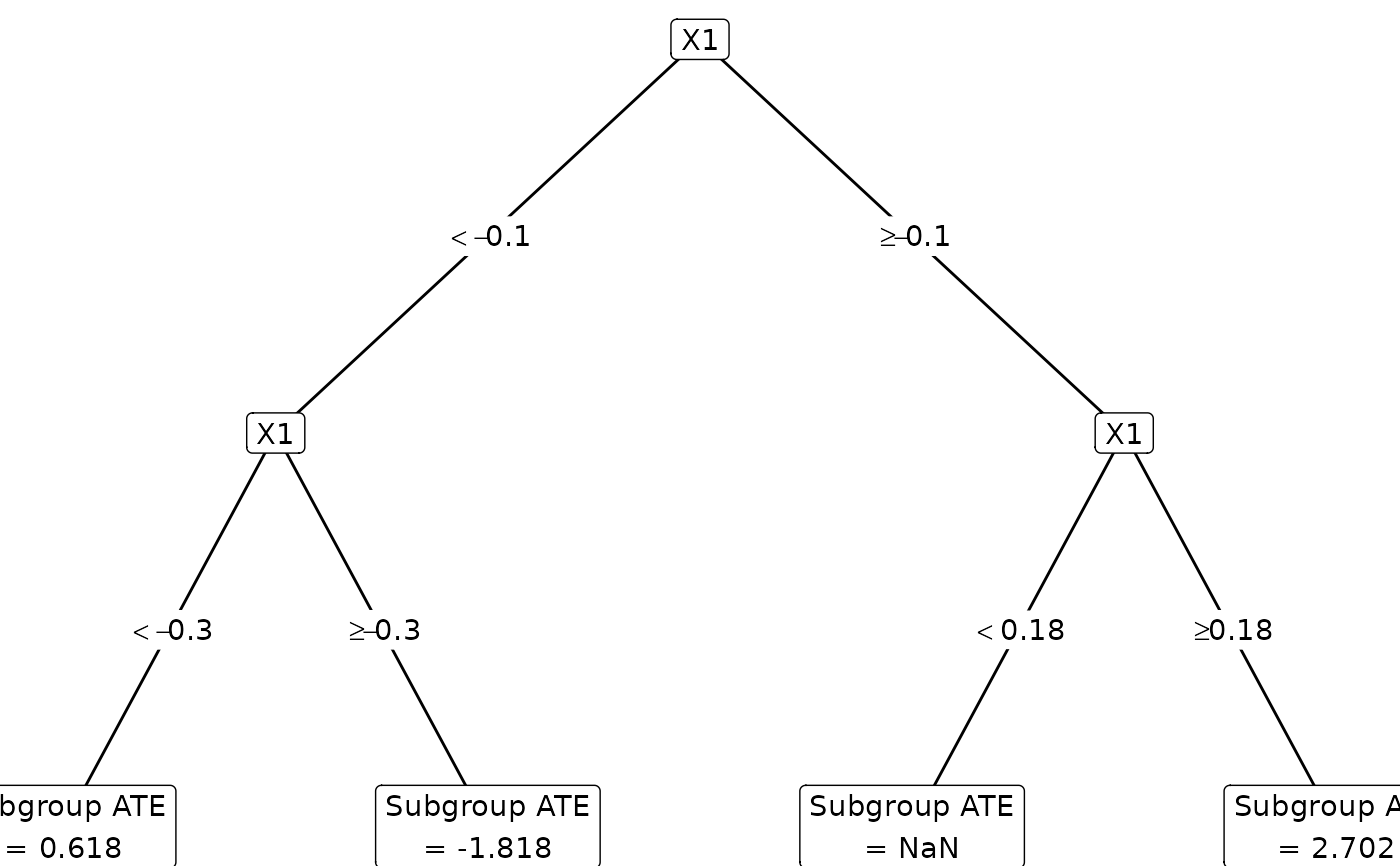
Plot causal distillation tree object
plot_cdt.RdVisualize the subgroups (i.e., the student tree) from a causal distillation tree object.
Arguments
- cdt
A causal distillation tree object, typically the output of
causalDT.- show_digits
Number of digits to show in the plot labels. Default is 2.
