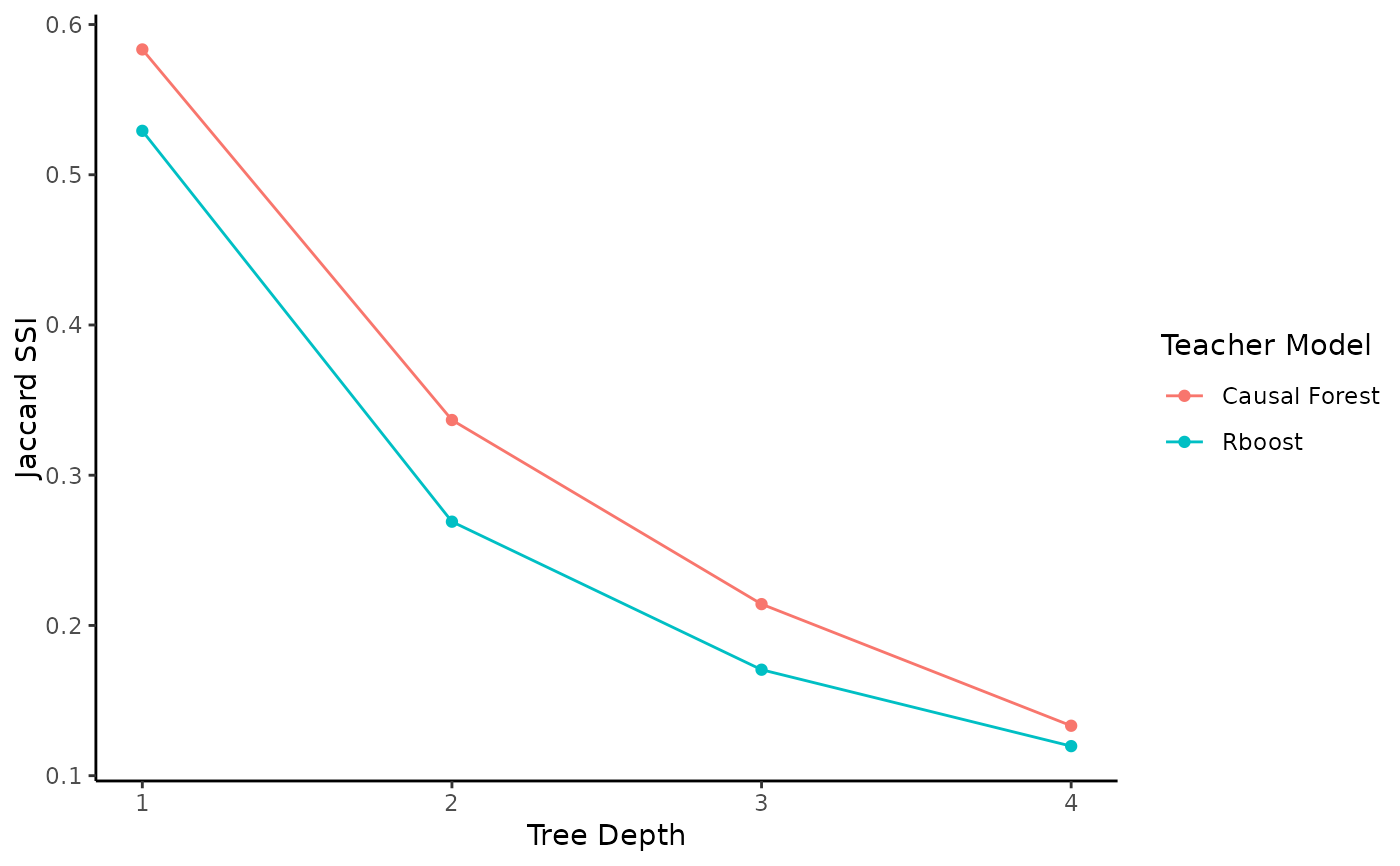
Plot Jaccard subgroup similarity index (SSI) for causal distillation tree objects
plot_jaccard.RdThe Jaccard subgroup similiarity index (SSI) is a measure of the similarity between two candidate partitions of subgroups. To select an appropriate teacher model in CDT, the Jaccard SSI can be used to select the teacher model that recovers the most stable subgroups.
Arguments
- ...
Two or more causal distillation tree objects, each is typically the output of
causalDT. Arguments should be named (so that they are properly labeled in the resulting plot).
Examples
# \donttest{
n <- 50
p <- 2
X <- matrix(rnorm(n * p), nrow = n, ncol = p)
Z <- rbinom(n, 1, 0.5)
Y <- 2 * Z * (X[, 1] > 0) + X[, 2] + rnorm(n, 0.1)

# number of bootstraps for stability diagnostics (setting to small value for faster example)
B <- 10

# run CDT with default causal forest teacher model
cdt1 <- causalDT(X, Y, Z, B_stability = B)

# run CDT with custom BCF teacher model
sink(tempfile())  # to suppress printed output from BCF
cdt2 <- causalDT(
  X, Y, Z,
  # set BCF training parameters to be small for faster example
  teacher_model = purrr::partial(bcf, nsim = 100, nburn = 10),
  teacher_predict = predict_bcf,
  # set number of cross-fitting replications to be small for faster example
  nreps_crossfit = 5,
  B_stability = B
)
#> Warning: A low (<1000) value for nburn was supplied
#> Warning: A low (<1000) value for nburn was supplied
#> Warning: number of items to replace is not a multiple of replacement length
#> Warning: number of items to replace is not a multiple of replacement length
#> Warning: A low (<1000) value for nburn was supplied
#> Warning: A low (<1000) value for nburn was supplied
#> Warning: number of items to replace is not a multiple of replacement length
#> Warning: number of items to replace is not a multiple of replacement length
#> Warning: A low (<1000) value for nburn was supplied
#> Warning: A low (<1000) value for nburn was supplied
#> Warning: number of items to replace is not a multiple of replacement length
#> Warning: number of items to replace is not a multiple of replacement length
#> Warning: A low (<1000) value for nburn was supplied
#> Warning: A low (<1000) value for nburn was supplied
#> Warning: number of items to replace is not a multiple of replacement length
#> Warning: number of items to replace is not a multiple of replacement length
#> Warning: A low (<1000) value for nburn was supplied
#> Warning: A low (<1000) value for nburn was supplied
#> Warning: number of items to replace is not a multiple of replacement length
#> Warning: number of items to replace is not a multiple of replacement length
sink() # restore normal output

# plot Jaccard SSI for both teacher models (note: in practice, use larger B)
plot_jaccard(`Causal Forest` = cdt1, `BCF` = cdt2)

# }
# }